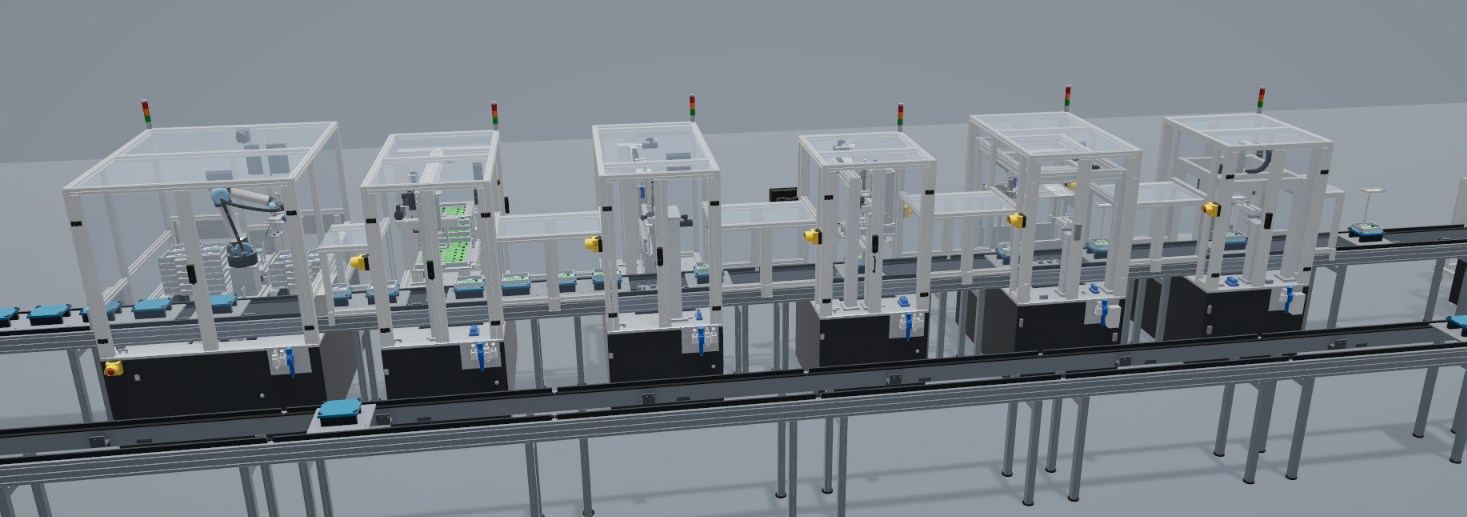
The purpose of predictive maintenance is to detect a developing fault early enough to plan an intervention, before it turns into an unplanned stop. Between the first detectable sign of a problem and the actual failure there is a time window, and the value of the method lies in how much of that window it can use.
Many projects of this kind begin by collecting data and looking for patterns. After some time there is a large amount of data, little of it is labeled, and there are few real failures to learn from, because a well-run line rarely fails. What is missing in those cases is a clear definition of normal behavior, and a link between a signal and a physical component.
What a model contributes
A definition of normal. The model knows the expected duration of each step and the expected order of signals. A deviation therefore has a reference point from the first day of operation, without having to wait for months of history. Measured values will differ from the model, so the reference is calibrated against the line’s own early operation. The model gives the structure of what to compare.
A map from signal to component. A deviation on a signal points to a specific axis or valve, and to a specific row in the parts list. The analysis ends with a concrete component, not with an anomaly in an unnamed channel.
Limits and meaning. The signal description records what is acceptable. On station S35, S35.Screw.Ok means torque and angle within the window, with a torque window of 0.35–0.45 Nm, and the values themselves are available as S35.Screw.Torque and S35.Screw.Angle. A result can stay within tolerance while its trend moves toward the limit, and this is the sort of information that a simple good/bad signal hides.
Known wear parts. The parts list can mark them already at the design stage. In S35, the screwdriver nosepiece is listed as a wear part, on a quick-change holder, as are the gripper suction cups, and a cycle counter (S35.Cycles) is available as a measure of their use.
Faults that can be rehearsed. The model can run with injected faults, which makes it possible to check in advance how a given fault appears in the signals, and whether the program detects it at all.
Candidate signals on one station
| Signal | Unit | What a trend may indicate |
|---|---|---|
S35.Screw.Torque |
Nm | Bit wear, a change in the screw or the threaded part |
S35.Screw.Angle |
° | Thread condition, part dimensions |
S35.Snap.PeakForce |
N | Snap dimensions, alignment, condition of the guide |
| Axis travel time | s | Mechanical resistance, drive or supply condition |
S35.Cycles |
count | Use of parts with a defined service life |
The interpretations in this table are hypotheses to verify on a real line, not established diagnostic rules. Their value is that they indicate where to look and which data to collect from the start.
What a model cannot do
A model predicts nothing without the real line. It does not simulate wear, and its parameters are not measured values. Predictive maintenance also requires:
- a read-only connection to the controller of the running line;
- sufficient operating history under real production conditions;
- often additional sensors, such as for vibration or temperature, because a control signal does not show every mode of failure;
- people in the plant who act on the results, since a warning has value only if someone is able to plan an intervention.
For many components, a simple condition-based or cycle-based service plan is enough. The investment makes sense where a stop is expensive and where the failure gives measurable early signs.
How the pieces fit together
- The design and the model are created in stages 1 and 2, including signal names and descriptions.
- The line starts, and the model runs alongside it, reading from the controller without writing to it.
- Actual cycle times and signals are compared with the expected ones, station by station.
- The reference is refined on the line’s own early data.
- Drift is reported with a location and a likely component, before it turns into a stop.
What is worth deciding at the design stage
Adding a sensor to a designed machine costs little, and adding it to a working one can be costly. It is worth deciding during stage 2 which values should be available in the controller as measurements, and not only as a good/bad bit, which components deserve condition monitoring, and how the data will be accessed.
All of this rests on a line that has actually been built as a model. The last article shows the one we use as a reference.